
一、Taming CSS: Web Developer Toolbar
Install Web Developer Toolbar. Just do it.
Debugging CSS can be really frustrating. The Web Developer Toolbar lets you inspect and edit (in real-time) the HTML and CSS of your page, so you can see what’s happening when things don’t line up. It can do a heck of a lot more, but here’s what I use it for:
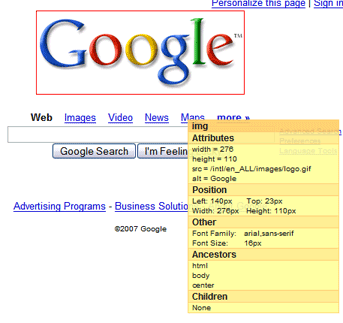
Ctrl + Shift + F: Display element information. This puts a red box under your mouse. Move the mouse over an element and its attributes appear in a pop-up: the name, class, pixel sizes, fonts, everything. Here’s what you can do:
- Figure out what classes are creating the styles you see
- Easily get the div’s id for use with Firebug (below)
- Figure out how big an image is (pixel height and width)
Ctrl + Shift + E: Edit CSS. This pops open a sidebar tab with the current stylesheets. You can edit any attributes and see the effect in real-time (like giving Google a black background):
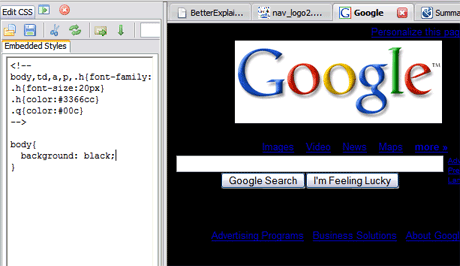
My favorite CSS style is border: 1px solid red;
I’ve done the following hundreds of times during the course of web development:
- Find a div with your mouse (ctrl + shift + f)
- Get its id
- Edit CSS (ctrl + shift + e)
- Put a border on the div: #mydiv{border: 1px solid red;}
- Play with widths, heights, margins and paddings until it lines up nicely
- Remove the border
But rather than deleting the border, put an “x” in front: “xborder: 1px solid red”. The CSS won’t be valid so the border is ignored, but keeps the style around in case you want to enable it later.
Select all the text in your edited CSS file and paste it into the real CSS file. Bam, your changes are now live. It’s almost the reverse of creating a file in DreamWeaver and viewing it in Firefox. You are viewing the live file in Firefox, making changes, and copying those back into your text editor. I’ve found this very effective for editing CSS, you avoid the constant back-and-forth switching because Firefox now has a CSS editor.
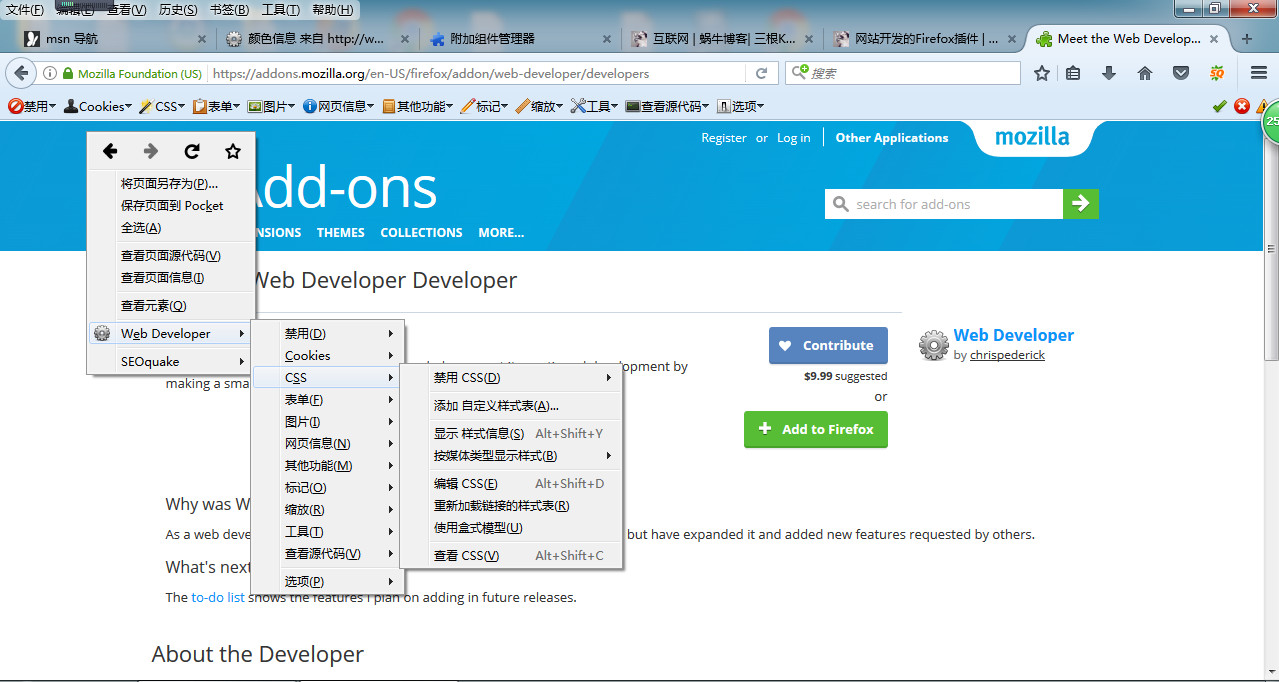
蜗牛博客updated: 试了一下上面两个快捷键都不行,安装之后通过上面的工具栏以及鼠标右键可以调用这个插件的功能。
Bonus: ColorZilla Picks Colors
ColorZilla gives you a dropper that can find the hex RGB value (#123456) of anything on the page. This is great when designing, and you want to match a font color to a color in your page. This is way faster than taking a screenshot and opening it up in Photoshop.
二、Keeping Javascript In Line: Firebug
Updated on Mar-10,今天忘记了怎么用了,截张图记一下,要点左下角那个箭头才行。
Firebug, how I love thee (or get the bookmarklet for other browsers). If you love yourself you will install it immediately and save countless hours of frustration.
Firebug can debug javascript, examine the DOM, and do much more (you can and should read all about it). Here’s how I use it:
F12: Open Firebug. You may have to enable it for the page.
Console Tab: Write quick javascript commands — it even has autocomplete on variable names and properties. Play around with your functions, change CSS attributes, add elements to the page — whatever it takes to test.
Script Tab (Debugging): Best. Feature. Ever. Click on a line number to set a breakpoint (red dot) in your javascript. Reload the page and it will break (pause) when it encounters the line.
At this point, you can switch over to the console to examine and change variables, and figure out what the heck is going on when your code won’t work. You can then hit the blue “play” button and continue running your app, until the next breakpoint.
Net Tab: Find the download performance of your page.
Profile Button (on Console Tab): Find the run-time performance of your page. Click “profile” to begin capturing information, do some commands, and then click stop. You’ll get a report of where your code spends its time. If you must optimize, optimize the common-case first.
If you are a more visual person, try this awesome collage:
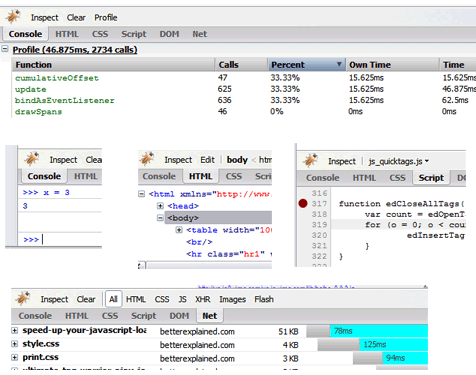
Not satisfied? Check out the examples on the home page.
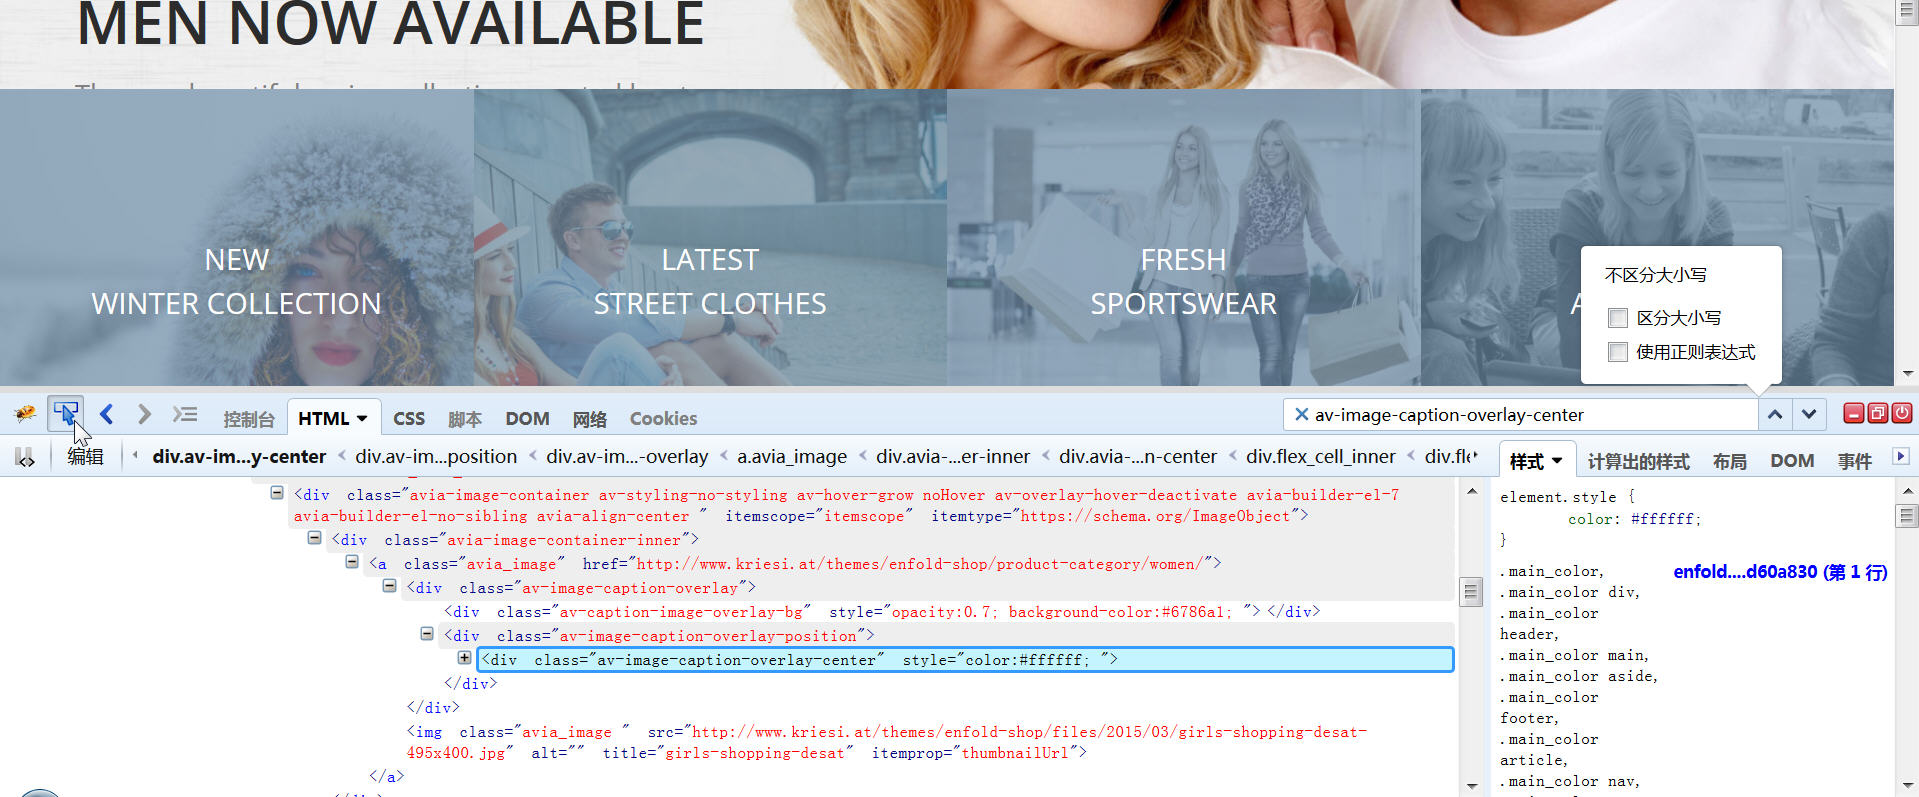
2017-Dec-23更新:
Firebug加上Firepath,可以轻易地得到元素的xpath和css path,不过Firebug已经停止更新。
所以 Mozilla 决定下一版本的 Firebug(项目代号「Firebug.next」)要以 Firefox 开发者工具打造,并将 Firebug 整合到内置工具中。
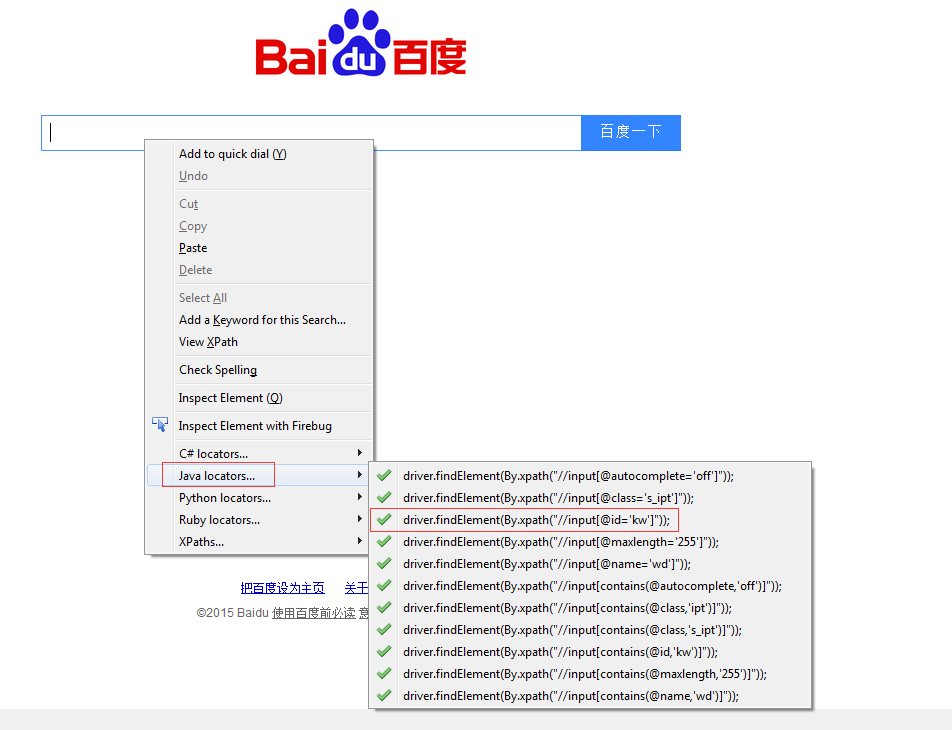
不过还有一个Firefox插件WebDriver Element Locator可以实现同样的功能。
三、Dive into the details: Live HTTP Headers
Sometimes you need to dive into the nitty-gritty. What cache headers is my site sending back? Are my pages really gzip-encoded?
I know these questions keep you up at night, so here’s what you can do:
- Install Live HTTP Headers
- Open it (Tools > Live HTTP Headers)
- Visit a page / press refresh
- Rejoice
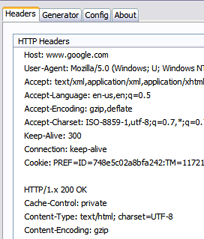
As you visit a page, you’ll see HTTP headers fly by as your browser requests elements. If items are cached, the browser may not request them at all (awesome!) or may request the element and get a 304 “Not Modified” response (slightly less awesome, you still had to check with the server). I’ve written more on cache behavior, and Live HTTP Headers is a great way to learn about HTTP caches (something every webdev should be interested in for performance reasons).
Even better, you can “replay” any header, editing the data that is sent. This is useful when testing or debugging cache or gzip encoding behavior.
四、Debugging IE: The lost chapter
Argh, unfortunately IE lacks these wonderful tools. There is a script debugger, but it doesn’t hold a candle to Firebug. In fact, I often just resort to alert statements, which make you shudder after being spoiled by Firebug.
One less painful method I use is this:
In your HTML: <div id="log"></div>

In your Javascript:

function log(str){
  var log = document.getElementById("log")
  if (log){ // let's be safe...
     log.innerHTML += str + "<br/>";
  }
}

Usage: log("Hi there!");

Optional: create an eval box:
<input name="eval" id="eval"/>
<a href="javascript:void(0);" onClick="log(eval(document.getElementById('eval').value));">go</a>
It’s nothing fancy, just a simple logging function that appends text to a div. Yes, it’s brutal, but it’s better than alert() statements, especially if you have a loop (unless you like repetitive stress injuries or want to condition yourself to fear dialog boxes). If anyone knows a good way to debug javascript in IE I’d love to know. The tools I’ve tried have been very clumsy and disjoint, taking you out of the browser.
I try to do 95% of my development in Firefox, and debug IE-specific issues (like erratic substr behavior) using this method.
Keep Getting Better
Web Developer Toolbar and Firebug can do way more than I’ve described here. Like the 80/20 rule, these are commands I use most frequently that give me the best bang for my buck. Take a few minutes to learn these tools and you’ll save hours down the line. And here’s a few more tools for web development.
These tools might not save you from getting a nervous twitch in one eye from building web apps, and that’s ok. They’ll save you from getting that twitch in both.
Updated on Mar-28-2017
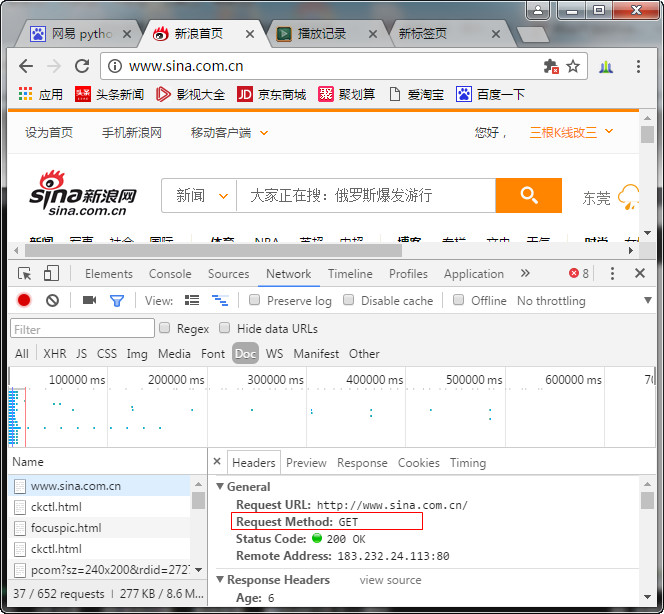
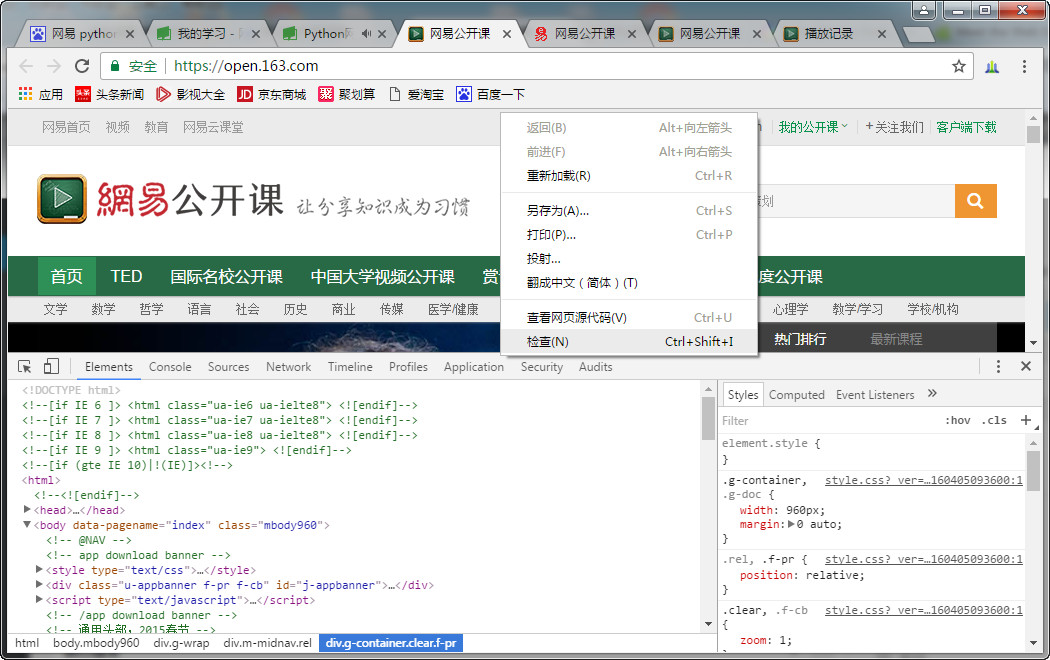
Chrome内置有开发者工具,通过鼠标右键——检查可以开启。
切换到Network,然后点刷新,相当于窃听器,就可以发现有82个Request。
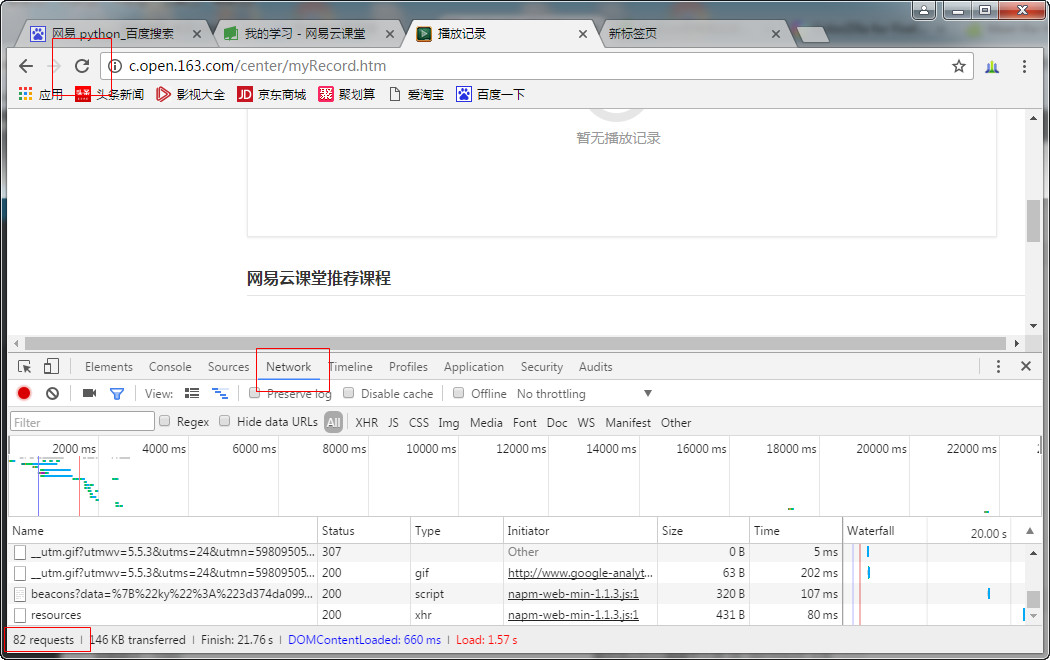
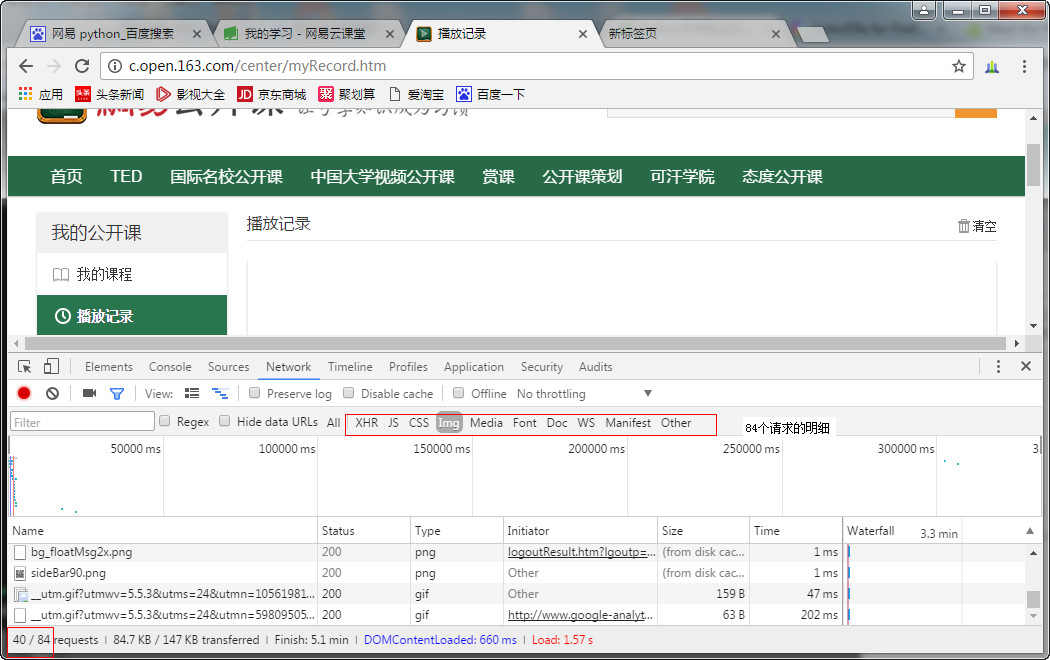
这里可以查看82个Request的明细
网页的内容一般在Doc下面,可以打开doc下面的链接,然后点response查看。
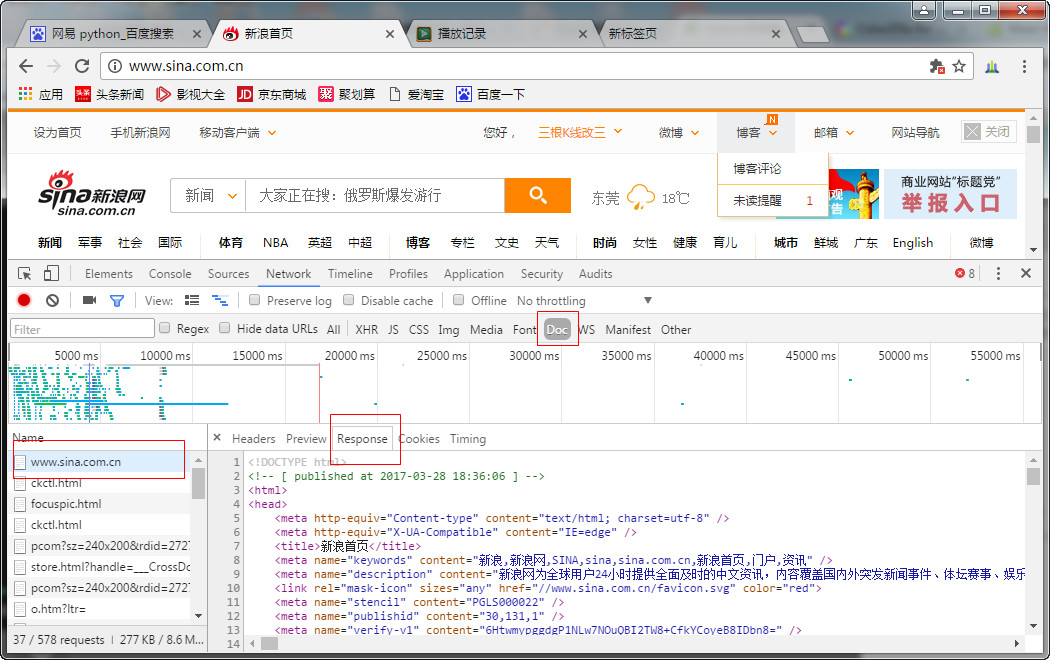
点击切换到headers,可以看到Request 方法:get