Summary: In 2016, invest with those who can supply safe assets. It tends to be those with lower balance sheet leverage. With zero rates, the ability of the developed nations to supply safe assets has diminished. And since the European sovereign crisis and the downgrade of US credit rating in 2011, China’s accumulation of US treasury has slowed. The “China-Dollar”, an important channel for the Fed to supply the world with liquidity, is vanishing. And China is suddenly confronted with surplus savings.
The “liquidity crisis” in 2013 and the burst of equity bubble in 2015 were triggered by leverage packaged in various forms to sate the surplus savings. But re-leveraging again in the coming year will be a tough ask - from a regulatory and a risk-aversion perspective. With low leverage, the government can still produce more safe assets through fiscal expansion and debt swaps. And surplus savings, or excess liquidity, will be safely absorbed by bonds - instead of stocks with high leverage and expensive valuation. This is different from the consensus view that stocks must rise amid abundant liquidity.
Improvement in the US current account and dollar strength suggest a looming liquidity event. The contagion from China’s slowdown cannot be disregarded. The yield gap between bonds and stocks suggests the fair trading value for stocks should be ~2,900.
------------------------------
A brave new world with few safe assets: In a world of zero interest rate, safe assets are in short supply. The fact that developed countries’ government bond yields continue to plunge, or that their bond prices are expensive, suggests that investors are willing to pay up for safety. As such, the ability to supply safe assets for excess savings to invest in is key, and lower leverage helps. In a brave new world, it will determine a country’s capital flow, economic growth, exchange rate and asset prices.
Around the time when the European sovereign debt crisis deepened and the US government bond rating was downgraded for the first time in 2011, China’s accumulation of US treasury started to slow. Meanwhile, Chinese net saving continues to rise, in part due to a lack of domestic investment opportunity. The confluence of rising net saving and slowing hoarding of US treasury has produced a surplus of savings, which has been growing ever since (Focus Chart 1). The Chinese savings are no longer destined for US treasury bonds as they used to, and are no longer squandering heavily in domestic investments.
Focus Chart 1: China’s accumulation of US treasury slows; net saving rises; saving surplus emerges.
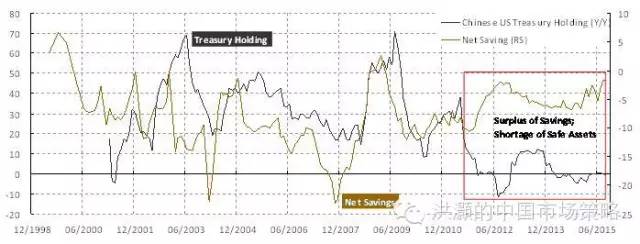
We believe that this is an important origin of the excess savings that have bewildered the investment community. In essence, with interest rates at zero bound, the supply of safe assets from developed countries is challenged. It is now up to China to supply its own safe assets.
An investment paradigm shift in China: In an ideal world, private households save and companies invest; the government’s budget is mildly expansionary and the balance of payment is largely even. These developments should show through the country’s economic growth, currency exchange rate, forex reserve and eventually asset prices.
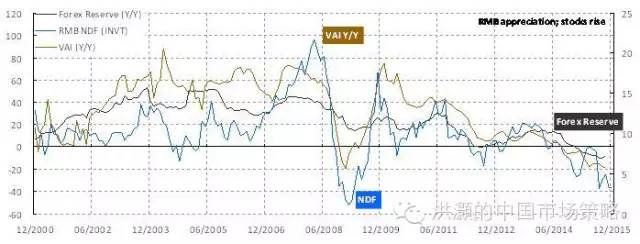
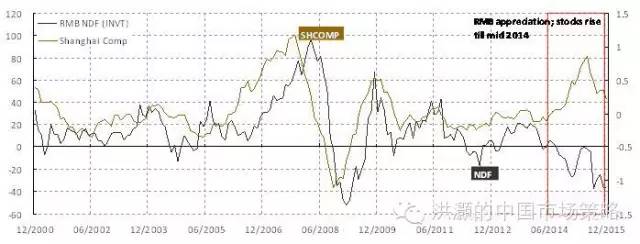
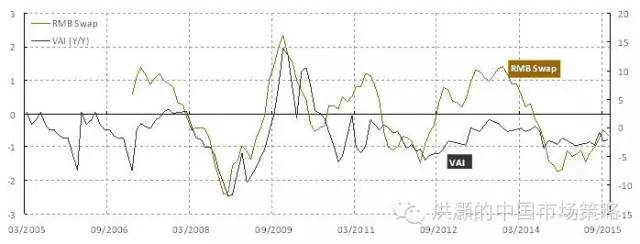
Indeed, the RMB exchange rate has been moving in tandem with China’s economic growth (VAI), the change in the forex reserve and asset prices – till mid 2014 when the RMB movements diverged from stocks. And so did those elements that used to influence the RMB exchange rate. That is, risk asset prices stopped reflecting economic fundamentals. A strong equity bull market ensued. As such, there has been an investment paradigm shift since mid 2014 (Focus Chart 2).
Focus Chart 2: Slowing economy and falling forex reserve reflected in weak RMB; stocks diverged from fundamentals.
2013 liquidity crisis and 2015 stock market bubble were leverage packaged in various forms: As aforediscussed, the ability of developed nations to produce safe assets has been compromised since the downgrade of US credit rating and the European sovereign crisis in the summer of 2011. China was suddenly confronted with a surplus of savings that used to be invested in developed nations’ bonds. With a lack of investment options, these savings rushed into bonds, as these were regarded as domestic safe assets. To satisfy the return requirement of many wealth management products, banks ramped up structural products and the non-standard assets on the banks’ balance sheet surged. But the duration of the banks’ liabilities was shortened as well, creating significant duration mismatch. Such developments led to the “liquidity crisis” in June 2013.
After the bailout of the liquidity crisis by the PBoC, the market realized that systematic risks were insured by the regulators. Products to leverage on an entirely different asset class – stocks – started to grow. Further, in March 2014 the PBoC expanded the RMB’s daily trading band to 2% to give it more trading flexibility. It had prompted a rapid depreciation of the Yuan, but had also facilitated the relative price adjustments through Chinese asset prices. As the stock market started to take off, the endorsement by the state media created an illusion of stocks as “quasi-safe assets”. We have all heard the burst of the bubble afterwards – with a bang.
The government will supply more safe assets; low leverage is key: Stocks are no longer safe, and the authority’s attitude is clearly to continue deleveraging. As savings stay to invest domestically, the question now is: which segment in China’s economy still has the ability to supply safe assets? The compositions of government and corporate balance sheets should give us the answer. The government’s leverage has been on the rise but still low at 58%, thanks to a substantial appreciation of its assets offsetting some rapid rise in debt. SOEs, on the other hand, have a leverage ratio of 150%, and are thus experiencing leverage fatigue. Within the listed universe, companies on the main board have a debt-to-equity ratio of 160% on average, while that of those on the ChiNext Board is around 25%.
As such, we would not be surprised to see the government becoming even more proactive on its monetary and fiscal policy, as well as its bond swap programs. We considered these policies as the government increasing supply of safe assets in the form of government bonds. But the increase in government bond supply will be easily absorbed by household savings, driving government bond yields even lower. For the corporate sector, the bubble burst in summer shows using margin to invest in companies that already have high financial leverage and low ROE is risky.
The difference in leverage and growth potential between the main board and the ChiNext can explain the return disparity between the two. In short, the government will increase supply of safe assets through bond issuance. And ChiNext’s strong relative performance can be explained by its lower leverage and higher growth. That said, the risk to ChiNext stocks is the looming supply once IPO registration is introduced. Such significant increase of new supply of a risk asset cannot be easily absorbed by household assets in an environment of risk aversion.
Monetary easing is well into second half: China’s real effective interest rate, after taking into account consumer and house price inflation, has fallen after rounds of interest cuts. That is, China’s monetary easing will continue into 2016, but is already more than half way through from a historical perspective. The real effective interest rate tends to lead the market by around six months as well. Real effective interest rate has peaked in January, coinciding with the peak of the bubble in summer (Focus Chart 3).
Focus Chart 3: Real rate will continue to fall. But monetary easing is well into second half.


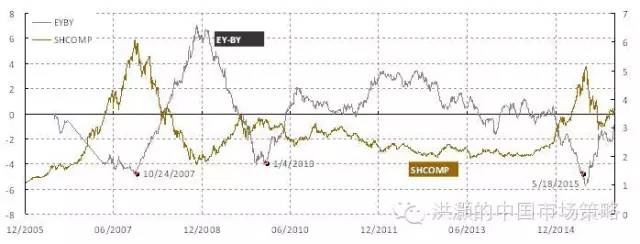
Stocks are still expensive relative to bonds; fair trading value ~2,900: Earnings yield relative to bond yield measures the relative attractiveness between stocks and bonds. The appeal of this approach is quite intuitive. Bond yield is a proxy of the cost of holding cash. When earnings yield is significantly higher than bond yield, cheap cash should be invested in stocks. And vice versa. Note that this measure is mean reverting and has shown good consistency with a well-defined range for the past decade (Focus Chart 4).
The yield gap approach has served us well. It has helped us negotiate the treacherous market during 2015. Indeed, the price target for the Shanghai Composite at 3,400, which we set using this approach at the beginning of the year, does not seem far off the target as 2015 is ending. The composite is lingering around 3,500 as we write.
Currently, the yield gap between earnings yield and bond yield is still below its long-term average. Assuming bond yield falls towards its historical low of 2.5%, and the yield gap rises back to his historical average, it will take the Shanghai Composite to 3,300 – a level where we have seen strong support in recent trading. If the yield gap continues its uptrend, as it used to after reverting from its historical low, the Shanghai Composite will be priced in a range between 2,500 and 2,900. As aforediscussed, stock’s role as a safe asset has diminished. Given stocks’ high leverage and pressure on earnings growth, it is likely that the uptrend in yield gap will persist as it used to.
Focus Chart 4: Stocks are still expensive compared with bonds.
The Dollar strength and US current account improvement hint at looming liquidity event: The US dollar continues to reign as the world’s dominant reserve currency. But such hegemony has not come without costs. As a global reserve currency, the US must be willing to dramatically expand its current account deficit to provide liquidity to other countries. Meanwhile, the Dollar will strengthen as the safe asset of the last resort during crises.
Think of the US current account deficit as a proxy of global savings, with the surplus in current accounts of exporting countries as a mirror image. Historically, the petrodollar, “China-dollar” and “Japan-dollar” have been recycled back to the US through these countries’ US treasury holdings after they received USD from their exports. It has been an important circuit for the US to provide global liquidity. In recent years, however, these dollars have gradually diminished with the slowdown in forex reserve accumulation in these countries. Meanwhile, the US current account deficit has improved substantially.
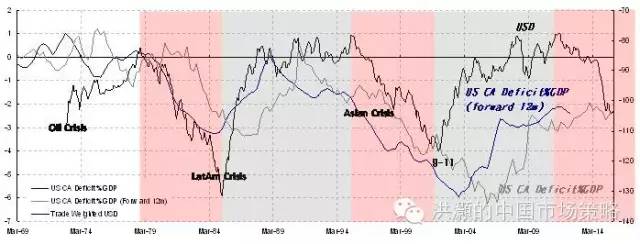
Dollar liquidity shortage will trigger systematic risks: Historically, every time the US current account improved, concurrent with US dollar strength, some country somewhere in the world plunged into some sort of crisis. We have seen this move before during the oil crisis in the 1970s, the LatAM crisis in the 1980s, Asian financial crisis in 1997, 9-11 and eventually the global financial crisis in 2008 (Focus Chart 5). All these crises were related to the US dollar shortage globally during the crisis periods.
Further, we note that the US dollar has a unique 17-year cycle: it tends to strengthen in the first six years of the cycle and then weaken in the ensuing ten years. When the dollar strength is nearing its peak at the end of the first six years, it tends to be in tandem with a crisis. Or put it in another way: the US current account improvement means dollar liquidity shortage for the world and the dollar strengthens accordingly. As crisis looms, the US must once again use its current account as a channel to provide system liquidity. As the US current account deteriorates, the US dollar weakens and the world gradually returns to normal.
2016 would be the sixth year of dollar strength. As the reform in China deepens, and deleveraging and capacity retrenchment progress, a looming global liquidity shortage will compound the complexity that China must confront in the coming year. China has made all the right moves heading into 2016. Interest rate liberalization and currency reform will greatly improve the country’s ability to negotiate the troubled waters. In the new year, the challenge is that we become too complacent with our reform achievements, and lose sight of risks of financial contagion as China’s financial system gradually opens up. Like Deng Xiaoping once remarked: “opening the window will bring in fresh air, as well as flies”.
Focus Chart 5: US dollar strengthening + improvement in US current account suggest looming liquidity event.
Hao Hong, CFA
2015-12-07
source:http://mp.weixin.qq.com/s?__biz=MzAwMTAwMzcxMg==&mid=401412823&idx=1&sn=626ebec184434f3c54e65fe02a7d2876&scene=2&srcid=1209go9MYhGCwjTQL47ujgGj&from=timeline&isappinstalled=0#wechat_redirect