

一、图表
1.图表类型
import matplotlib.pyplot as plt
 plt.hist()   #频数直方图
 plt.plot()   #线图,传入序列,元组、列表、numpy.ndarray
 plt.pie()
 plt.bar()
 plt.show()
 plt.scatter()
2.画图
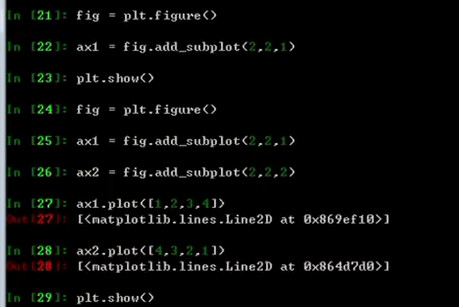
fig = plt.figure()  创建一块画布
#将fig分成2*2,1表示是第一个图
ax1 = fig.add_subplot(2,2,1)
二、双均线策略
import pandas as pd
import numpy as np
import matplotlib.pyplot as plt

df = pd.read_csv('601318.csv', index_col='date', parse_dates=['date'])

df['ma5'] = np.nan
df['ma10'] = np.nan

# 第一步计算ma
# 循环计算,速度非常慢
#df.loc只能传行或列的名进去,loc左边是行,右边是列

# for i in range(4, len(df)):
#     df.loc[df.index[i], 'ma5'] = df['close'][i-4:i+1].mean()
# for i in range(9, len(df)):
#     df.loc[df.index[i], 'ma10'] = df['close'][i-9:i+1].mean()

# 方案2:cumsum

# close     =  [10, 11, 12, 13, 14, 15, 16]
# close.cumsum=[10, 21, 33, 46, 60, 75, 91]
#                                -   -   -
#               [nan,nan,nan,nan,0,  10, 21, 33, 46, 60, 75, 91]

# sr = df['close'].cumsum()
# df['ma5'] = (sr - sr.shift(1).fillna(0).shift(4))/5
# df['ma10'] = (sr - sr.shift(1).fillna(0).shift(9))/10

# 方案3:rolling

df['ma5'] = df['close'].rolling(5).mean()
df['ma10'] = df['close'].rolling(10).mean()

df = df.dropna()

df[['ma5', 'ma10']].plot()
plt.show()
# 第二部 判断金叉死叉
# 方案一
# 金叉 短期<=长期 短期>长期
# 死叉 短期>=长期 短期<长期
# sr = df['ma5'] <= df['ma10']
#
# golden_cross = []
# death_cross = []
# for i in range(1, len(sr)):
#     # if sr.iloc[i] == True and sr.iloc[i + 1] == False: 开始想的是加1,但是索引溢出
#     if sr.iloc[i - 1] == True and sr.iloc[i] == False:
#         golden_cross.append(sr.index[i])
#     if sr.iloc[i - 1] == False and sr.iloc[i] == True:
#         death_cross.append(sr.index[i])

# 方案2

golden_cross = df[(df['ma5'] <= df['ma10']) & (df['ma5'] > df['ma10']).shift(1)].index
death_cross = df[(df['ma5'] >= df['ma10']) & (df['ma5'] < df['ma10']).shift(1)].index
三、一个简单的回测框架
成果展示:
代码:
import pandas as pd
import matplotlib.pyplot as plt
import tushare
import datetime
import dateutil
'''
获取所有的股票交易日,交易日信息保存在csv文件
'''
try:
trade_cal = pd.read_csv("trade_cal.csv")
except:
trade_cal = tushare.trade_cal()
trade_cal.to_csv("trade_cal.csv")
class Context:
def __init__(self, cash, start_date, end_date):
'''
保存股票信息
:param cash: 现金量
:param start_date: 量化策略开始时间
:param end_date: 量化策略结束时间
:param positions: 持仓股票和对应的数量
:param benchmark: 参考股票
:param date_range: 开始-结束之间的所有交易日
:param dt: 当前日期 (循环时当前日期会发生变化)
'''
self.cash = cash
self.start_date = start_date
self.end_date = end_date
self.positions = {} # 持仓信息
self.benchmark = None
self.date_range = trade_cal[(trade_cal['isOpen']==1)&
(trade_cal['calendarDate']>=start_date)&
(trade_cal['calendarDate']<=end_date)]['calendarDate'].values
self.dt = None
class G:
'''
保存用户的全局参数
'''
pass
'''
默认的初始化信息
'''
g = G()
CASH = 100000
START_DATE = '2016-01-07'
END_DATE = '2017-01-31'
context = Context(CASH,START_DATE,END_DATE)
def attribute_history(security,
count,
field=('open','close','high','low','volume')):
'''
获取某股票count天的历史行情,每运行一次该函数,日期范围后移
:param security: 股票代码
:param count: 天数
:param field: 字段
:return:
'''
end_date = (context.dt - datetime.timedelta(days=1)).strftime('%Y-%m-%d')
start_date = trade_cal[(trade_cal['isOpen']==1)&
(trade_cal['calendarDate']<=end_date)][-count:]['calendarDate'].iloc[0]
return attribute_daterange_history(security,start_date,end_date,field)
def attribute_daterange_history(security,
start_date,end_date,
field=('open','close','high','low','volume')):
'''
底层,获取某股票某一段时间的历史行情
:param security:
:param start_date:
:param end_date:
:param field:
:return:
'''
df = tushare.get_k_data(security,start_date,end_date)
df.index = df['date']
return df[list(field)]
def get_today_data(security):
'''
获取context的"当天"的股票信息,停牌返回Null
:param security:
:return:
'''
try:
today = context.dt.strftime('%Y-%m-%d')
df = tushare.get_k_data(security,today,today)
df.index = df['date']
data = df.loc[today]
except KeyError: # 股票停牌
data = pd.Series()
return data
def _order(today_data, security, amount):
'''
底层买股票的函数
:param today_data: "当天"的股票价格OCHL
:param security: 股票代码
:param amount: 交易股数,正数为买入,负数为卖出
:return:
'''
p = today_data['open']
# 找不到该股票默认为0股
old_amount = context.positions.get(security, 0)
if len(today_data) == 0:
print("今日停牌")
return
if context.cash - amount * p < 0:
amount = context.cash // p
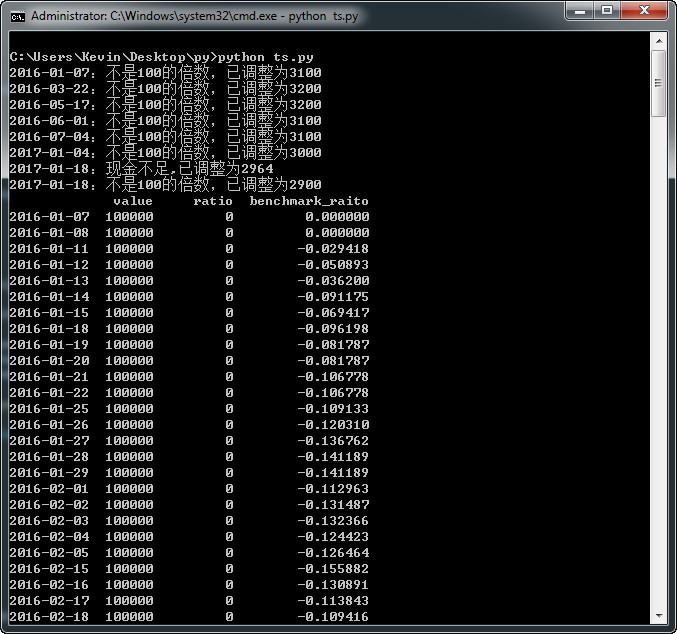
print('%s:现金不足,已调整为%d' %(today_data['date'],amount))
if amount % 100 != 0:
# 买或卖不是100的倍数就调整为100的倍数,卖光则不调整
if amount != -old_amount:
# 2345 => 2300
amount = int(amount / 100) * 100
print('%s:不是100的倍数,已调整为%d' %(today_data['date'],amount))
if old_amount < -amount:
amount = -old_amount
print('%s:卖出股票不能超过持仓数,已调整为%d'%(today_data['date'],amount))
# 更新持仓信息
context.positions[security] = old_amount + amount
# 更新钱
context.cash -= amount*p
# 持仓为0就删掉
if context.positions[security] == 0:
del context.positions[security]
def order(security, amount):
# 买入股票。amount为正表示买入,负表示卖出
today_data = get_today_data(security)
_order(today_data, security, amount)
def order_target(security, amount):
# 把股票交易到多少股,不能为负数,比原来小是卖出,比原来大是买入
if amount < 0:
print("数量不能为负,已调整为0")
amount = 0
today_data = get_today_data(security)
hold_amount = context.positions.get(security, 0) # TODO: T + 1 closeable total
delta_amount = amount - hold_amount
_order(today_data,security,delta_amount)
def order_value(security, value):
# 买多少钱的股票或者卖多少钱的股票
today_data = get_today_data(security)
amount = value / today_data['open']
_order(today_data,security,amount)
def order_target_value(security, value):
# 买到或者卖到多少钱
if value < 0:
print("价值不能为负,已调整为0")
value = 0
today_data = get_today_data(security)
hold_value = context.positions.get(security,0) * today_data['open']
dalta_value = value - hold_value
order_value(security,dalta_value)
def run():
plt_df = pd.DataFrame(index=pd.to_datetime(context.date_range),
columns=['value'])
# 最初的钱,算收益率用
init_value = context.cash
# 保存停牌前一天的股票价格
last_price = {}
# 用户接口1
initialize(context)
for dt in context.date_range:
context.dt = dateutil.parser.parse(dt)
# 用户接口2
handle_data(context)
# 股票和现金的总价值
value = context.cash
for stock in context.positions:
# 考虑停牌的情况
today_data = get_today_data(stock)
if len(today_data) == 0:
p = last_price[stock]
else:
p = today_data['open']
last_price[stock] = p
value += p * context.positions[stock]
plt_df.loc[dt, 'value'] = value
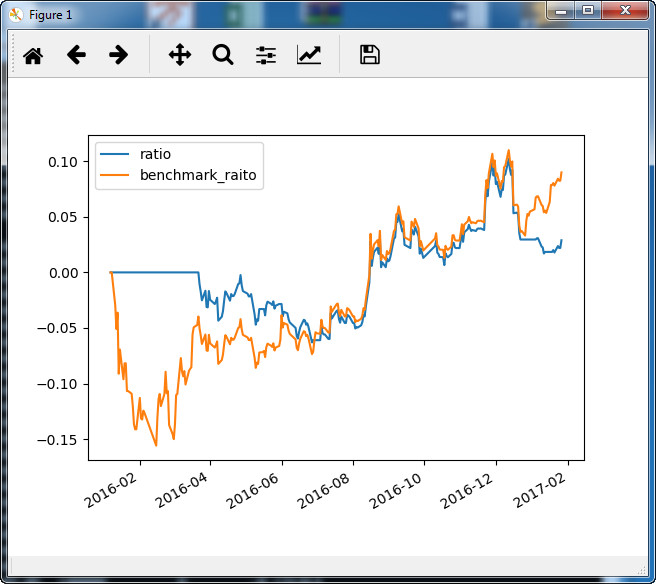
plt_df['ratio'] = (plt_df['value']-init_value) / init_value
bm_df = attribute_daterange_history(context.benchmark,
context.start_date,
context.end_date)
bm_init = bm_df['open'][0]
plt_df['benchmark_raito'] = (bm_df['open']-bm_init) / bm_init
print(plt_df)
plt_df[['ratio','benchmark_raito']].plot()
plt.show()
'''
initialize和handle_data是用户的操作
'''
def initialize(context):
context.benchmark = '601318'
g.p1 = 5
g.p2 = 60
g.security = '601318'
def handle_data(context):
hist = attribute_history(g.security, g.p2)
ma5 = hist['close'][-g.p1:].mean()
ma60 = hist['close'].mean()
if ma5 > ma60 and g.security not in context.positions:
order_value(g.security, context.cash)
elif ma5 < ma60 and g.security in context.positions:
order_target(g.security,0)
if __name__ == '__main__':
run()
相关说明:
tushare.trade_cal() # 获取交易日信息,输出结果为:
calendarDate isOpen
0 1990/12/19 1
1 1990/12/20 1
2 1990/12/21 1
3 1990/12/22 0
4 1990/12/23 0
5 1990/12/24 1
6 1990/12/25 1
7 1990/12/26 1
8 1990/12/27 1
9 1990/12/28 1
10 1990/12/29 0
11 1990/12/30 0
12 1990/12/31 1
13 1991/1/1 0